 BBQ-Cloud
My Homelab for 2024 Part 3
Infrastructure supporting services
Authentication
After deploying the first services I wanted to add authentication everywhere because some webUI like Longhorn or Thanos do not implement auth. At the beginning I did basicauth with my traefik ingress but I quickly searched for a true Single Sign On solution. My criteria were :
- Forward auth compatible to use it with traefik
- All in one solution
- OpenID provider
- FIDO keys support
So I tried authentik then found it complicated for nothing, and this BUG…
Then I found Authelia and use it now for everything. It is running in front of the services that needs auth because they do not provide it themselves. Services that are compatible with OpenID use it as a provider, that way I can login one time and acces everything. I use Yubikeys as my second factor.
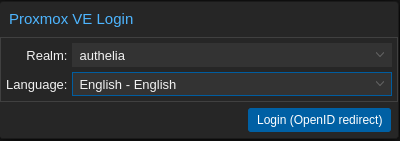
Here is the proxmox exemple
All my authelia users are stored in a LDAP database, I use LLDAP to manage them, it is a very lightweight ldap implementation that is perfect for that use case.
I use the following middleware in traefik for the services that can not do OpenID :
|
|
Configuration management
I used Ansible several times for work and found it amazing. We also leverage AWX to manage / launch our playbooks stored in GIT but for the Homelab I wanted to try to little brother of AWX : Semaphore. Features parity is not here, but for the homelab it will cover my needs.
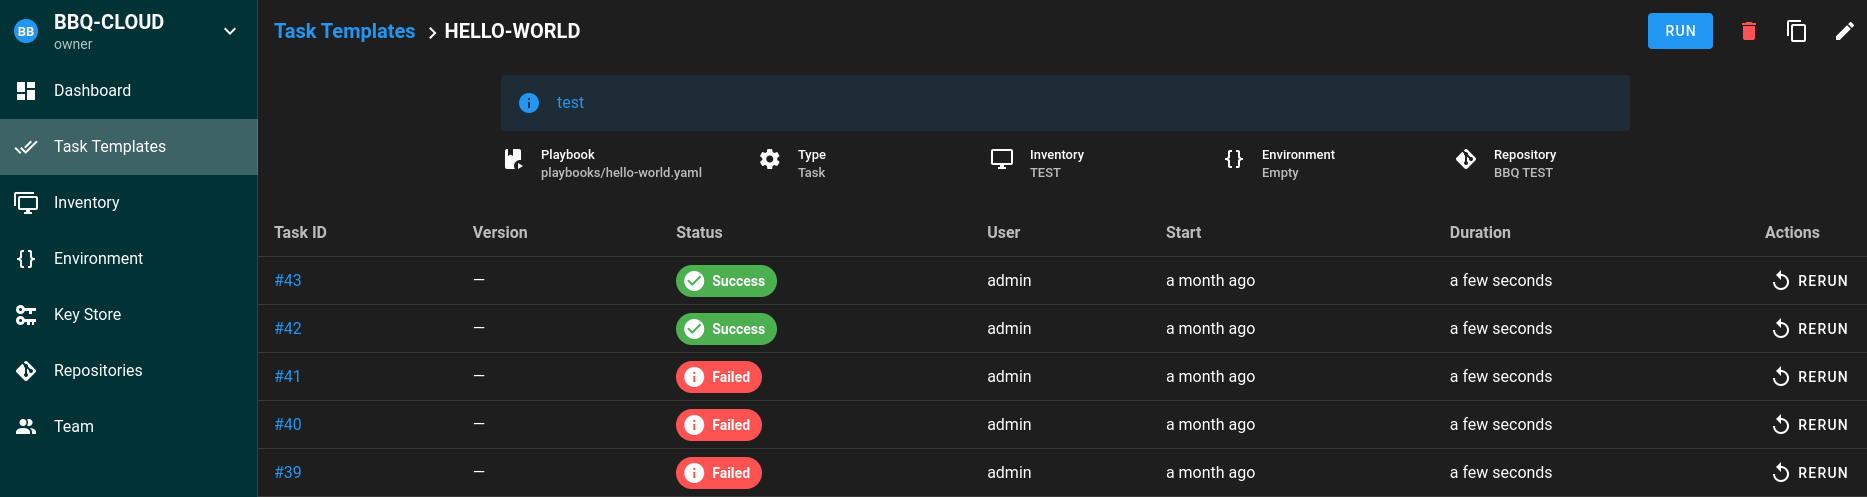
Just managed to launch a playbook with everything stored in my git !
The CI / CD Stack
GitOps
As said in Part 1, I have a Gitea instance ( soon to be replace by Forgejo ) that store every single YAML files deployed in my Kubernetes Cluster. I use the GIT as a single source of truth for the cluster. I will try to extend that beyond the Kubernetes cluster, with my VM on the proxmox nodes and with Ansible.
CI
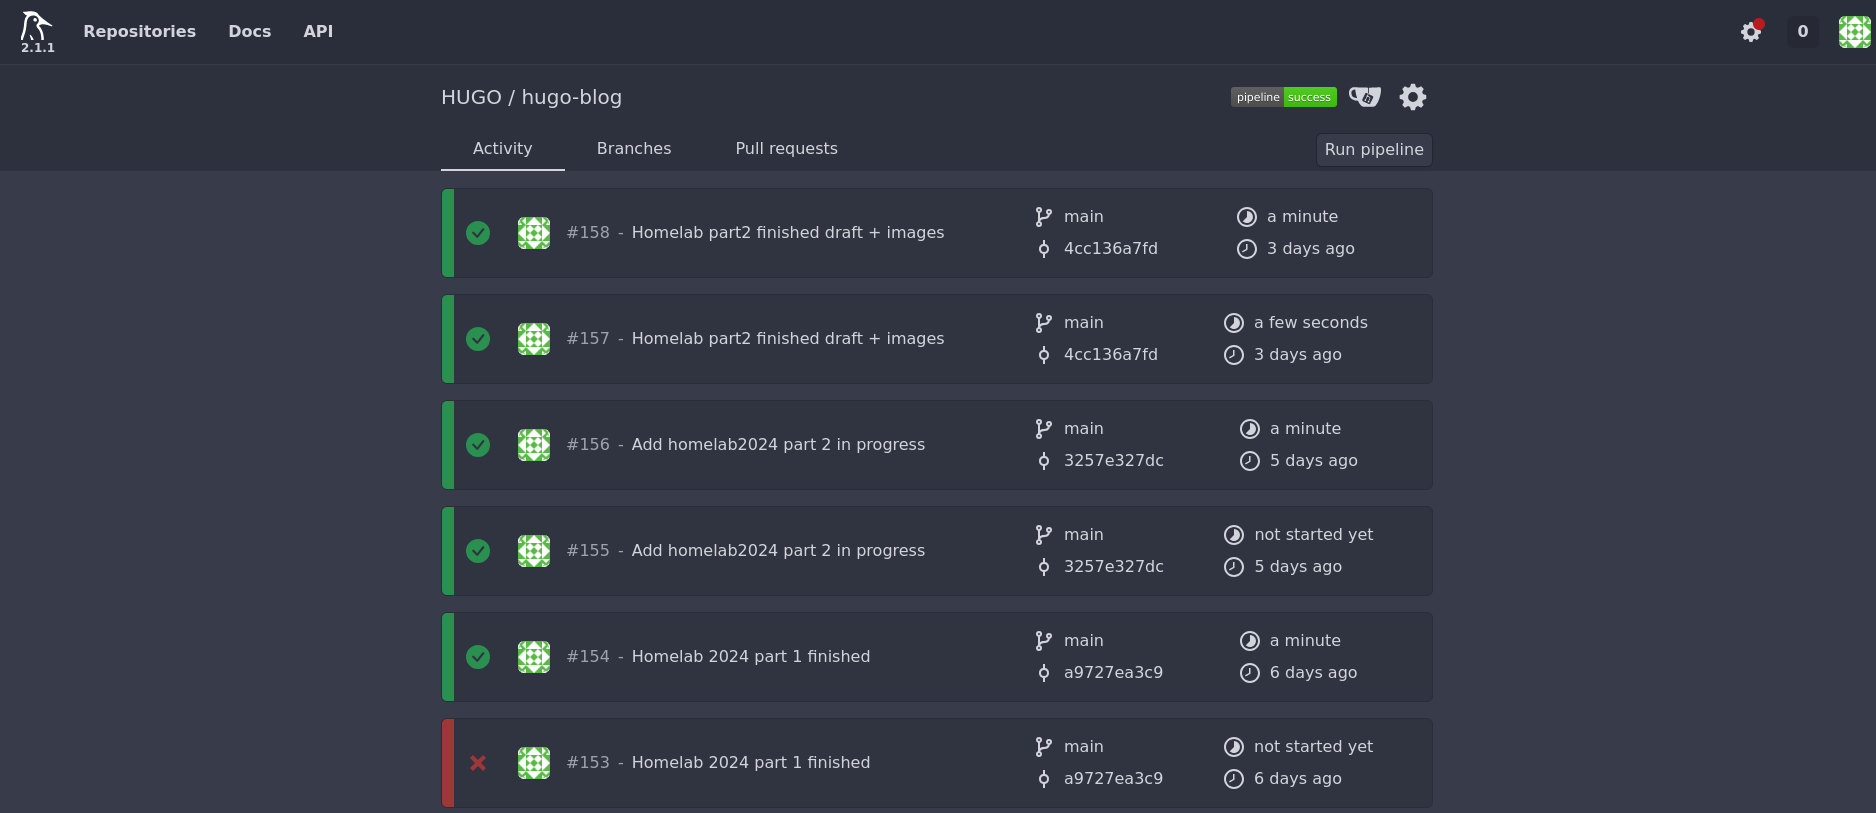
I use Woodpecker as my CI tools to build this website for example and some container Images. Nothing fancy here, juste a standard woodpecker install that runs in Kubernetes and launch pods for each steps in the pipeline. I use Kaniko to build docker images in kubernetes and push them in my private registry.
CD
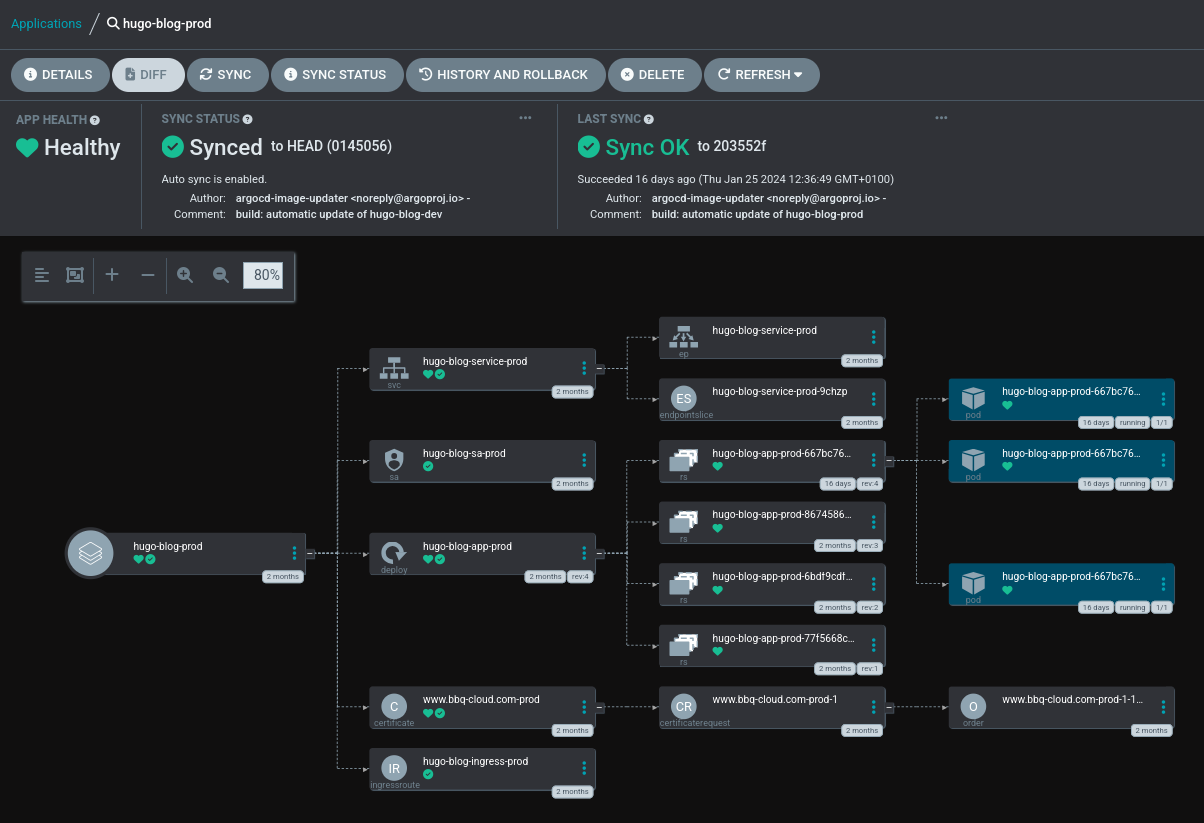
ArgoCD is the tool that sync everything between my GIT repo and my cluster. I deployed it in HA mode with the YAML files of the project. With autosync and autoheal enabled it will fix the cluster if the state drifts from the desired one that is stored in Git. There is an additional tool that you can use : ArgoCD Image Updater, that will update the image of your app if it finds a new one in the registry.
But asides from that Image updating part, ArgoCD is a wonderfull tool that also provide a nice view on all your apps :
I use it to deploy plain YAML files, Kustomize files and I recently found that you can deploy a Helm chart from a repo with values from another repo so I will migrate all my Helm chart to ArgoCD ! I should be able to get rid of the image updater addon with using Renovate bot… I also love the fact that your ArgoCD apps objects can be deployed as plain YAML too because they are CRDs, Argo store everything in Kube and do not need a Database or persistent volume :
|
|
You can also see there the annotations used to config to image updater addon and the teams notifications on succesfull sync.
Cloud Native Postgres
For sure one of my favorite tool of the stack… And this one was suggested to me by someone on reddit, thanks for this one mate, I do not know your username anymore sorry…
CNPG is the solution I use to deploy all my databases. I went with postgres because of that operator, it just works, and without single failure since the start for me… And trust me I broke it everyway possible at the start and never lost a single bit of data… CNPG will do all of this for you:
- Bootstrap a replicated PGSQL cluster with 3 members in my case
- Init the DB and the user
- Init from a previous backup if you need to
- Create a scheduled backup of your DB to a S3 storage
- Create the key / certificates combo used to connect to your database
- Store them in a regular kube secret to let you use it in your app
- Deploy an exporter to let you watch you cluster with prometheus.
- Selfheal your cluster if you destroy a member…
- More cool shit that I’m not aware of…
It works well with ArgoCD as you can definie your DB cluster as YAML files like so :
|
|
Monitoring stack
High Available Metrics Gathering


I use Prometheus and Thanos deployed in Kubernetes with the kube-prometheus-stack. It ease the setup of :
- Prometheus operator that will deploy and configure Prometheus and AlertManagers
- Prometheus instances, 3 in my case, with local volume like CNPG
- AlertManagers Instances
- Sidecars for the prometheus instances that Thanos will need
- Kube State Metrics which is a Kubernetes exporter
- Node exporter deployed as a DaemonSet on all kube nodes
- All the needed CustomRessourceDefinitions
- Grafana to view dashboards
I found this HelmChart very good, you will need a good amount of time to read the values file and customize it for your needs but the default is killer to get started fast. I added a lot of exporters to the defaults ones :
- Every linux server outside my cluster with the Node exporter
- Powerdns cluster metrics exported by recursors and authoritative servers + piHole exporter
- Blackbox exporter to monitor HTTP metrics of my services
- PushGateway that is used to receive asynchronous metrics like K8UP job completions
- SNMP Exporter to poll SNMP on my NAS and Unifi devices, switches…
- Speedtest Exporter for internet bandwidth checks
I also try to gather metrics from all the services that supports it by leveraging ServiceMonitors or PodMonitors:
- Prometheus / Thanos components metrics
- Loki components
- Grafana
- Authelia
- Traefik
- CNPG clusters
- Healthcheckio status
- Longhorn
- Argo and woodpecker
- …and everything that can expose a /metrics endpoint ^^
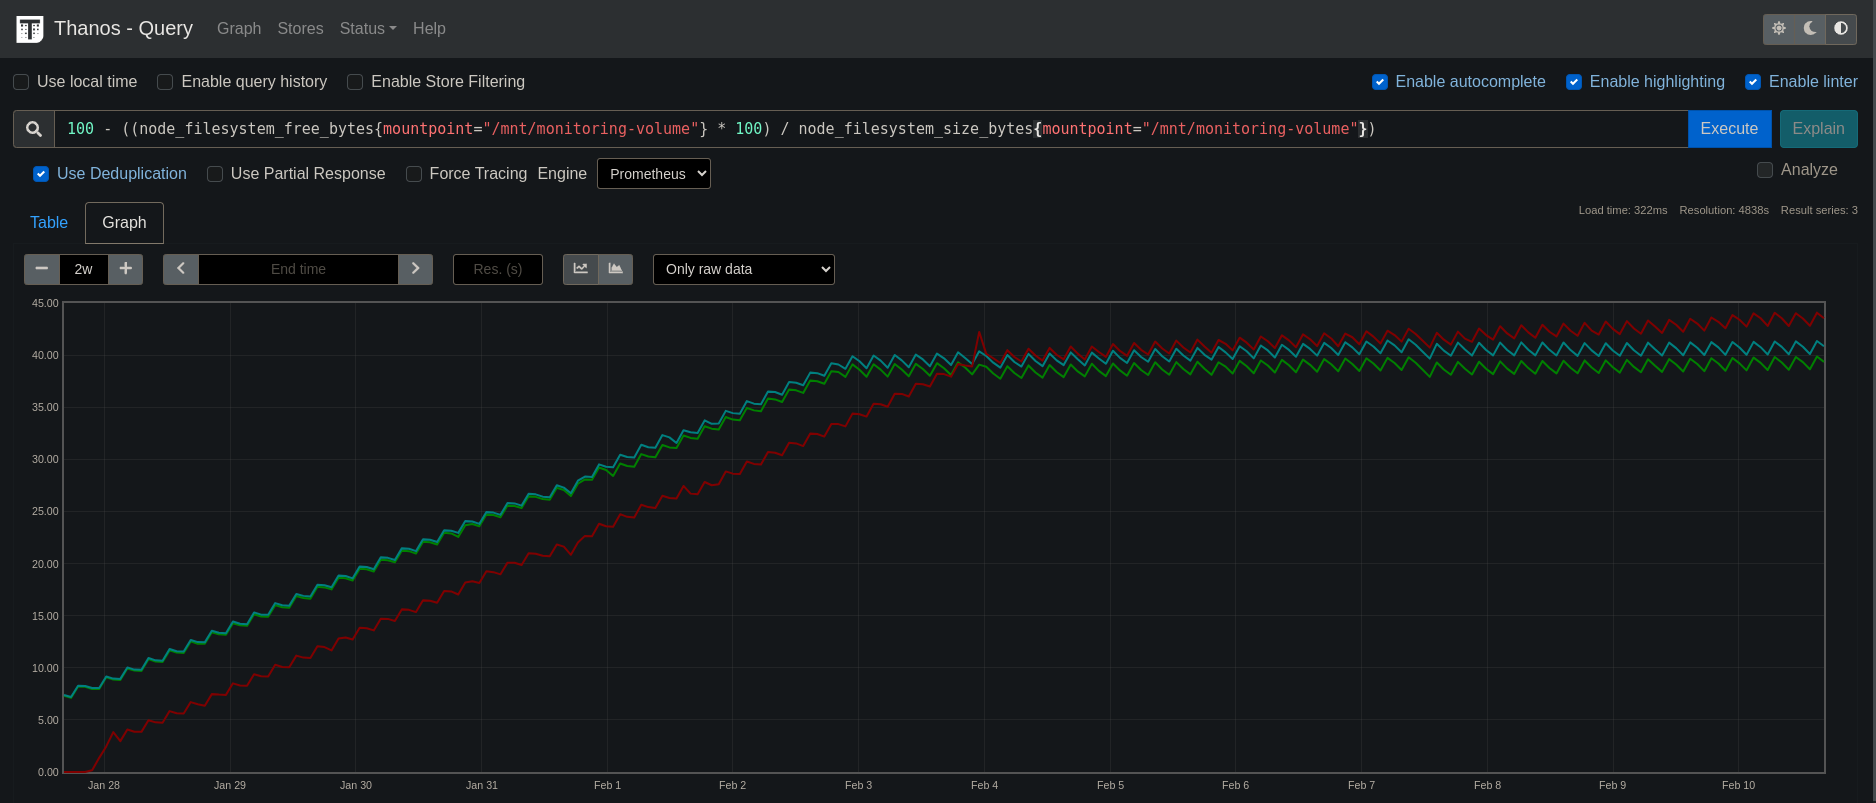
On top of that I use thanos to be able to query my 3 prometheus instances, and ship the data to S3 compatible minio on my NAS. I keep one week of data on the prometheus instances, in case of NAS failure I have 7 days of metrics to look for if needed. Then I keep one year on the NAS with the compactor downsampling the data to 1 hour after 30days. In my every day usage, I do my queries with the Thanos webUI, and look alerts on it too. My Grafana is also connected to the Thanos query frontend.
I used the bitnami chart for Thanos to help with the config of :
- Thanos querier that will fetch metrics from Sidecars and Storage Gateway
- Thanos query frontend that enhance the query path with caching and retry
- Thanos compactor that will compact / downsample TSDB block in your s3 storage
- Thanos storage gateway that make your S3 storage available as a datasource for the querier !
Visualize the data
Of course Grafana is used because it is the best Open Source visualization product on earth !
In kubernetes your can configure it to be autoprovisionned from configMaps, that way the datasources and the Dashboards are kubernetes objects that can be stored in my Git and deployed with ArgoCD. I gathered some dashboards from internet, some comes directly from helm-charts or operator, and some from me. I’m currently in the process of migrating my own dashboards to configMaps to make my Grafana “stateless”.
Here are some example :

Overview of the kubernetes cluster

Overview of one CPNG cluster

BlackBox probe metrics panel
Checking alerts
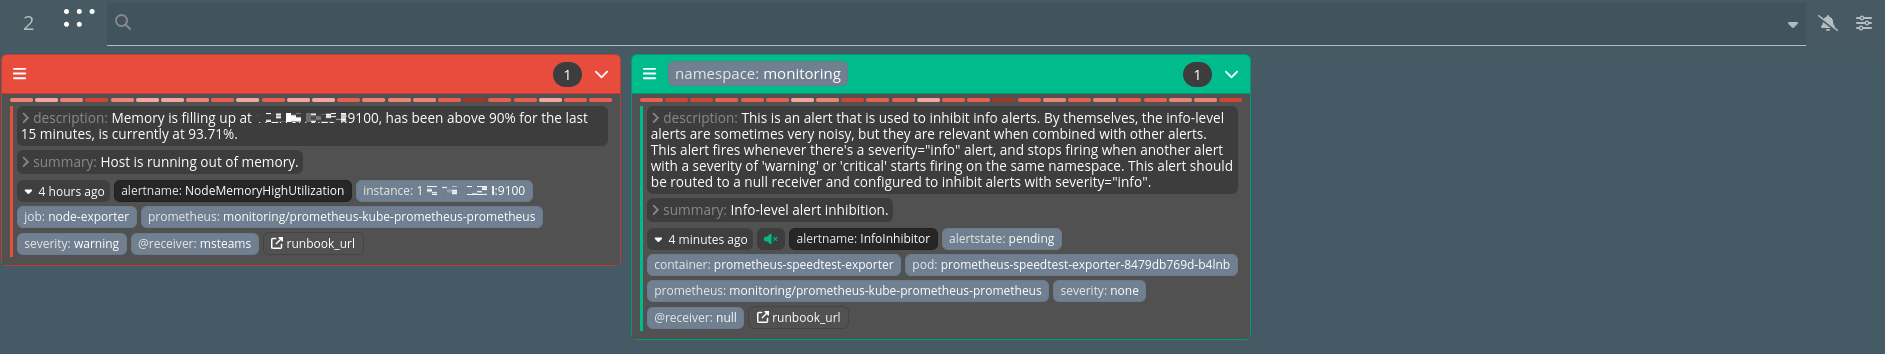
I also have a screen always on with Karma on it which only display alerts
Healthchecksio
To monitor my cron tasks and backups that are not in Kubernetes I deployed Healthchecksio. In two words : a service that will wait for the process you want to say Hello ! on a defined schedule and send you alerts when it does not…
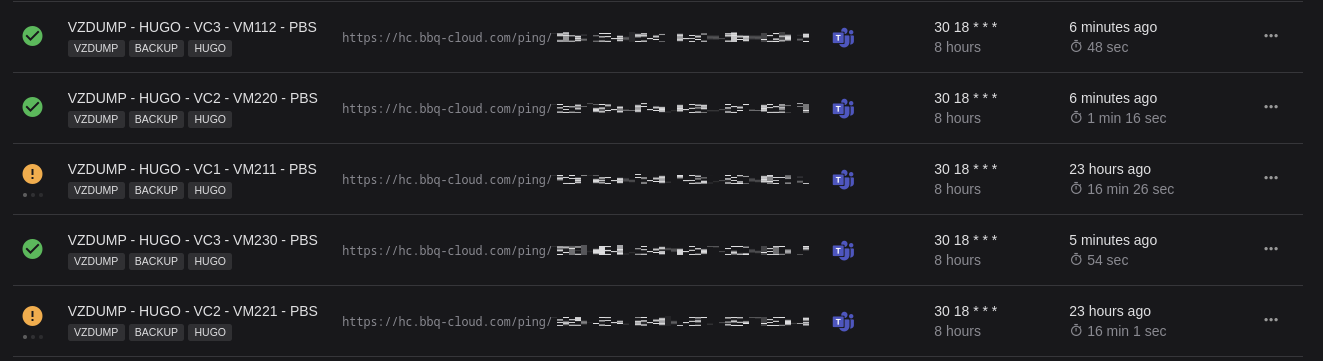
Here we can see that some of my backup are in progress, in yellow. Green ones are already done
Website analytics
This website use Umami to do analytics. I considered Matomo too but the lack of postgres support made me give up the idea. I did not want to deal with two database operators just for Matomo. Umami is also simpler / lighter. Initially I was using a HUGO theme that was not compatible with Umami so I hid the script snippet in the footer but since I switched to a Umami compatible theme I should remove that and use the regular config.toml…
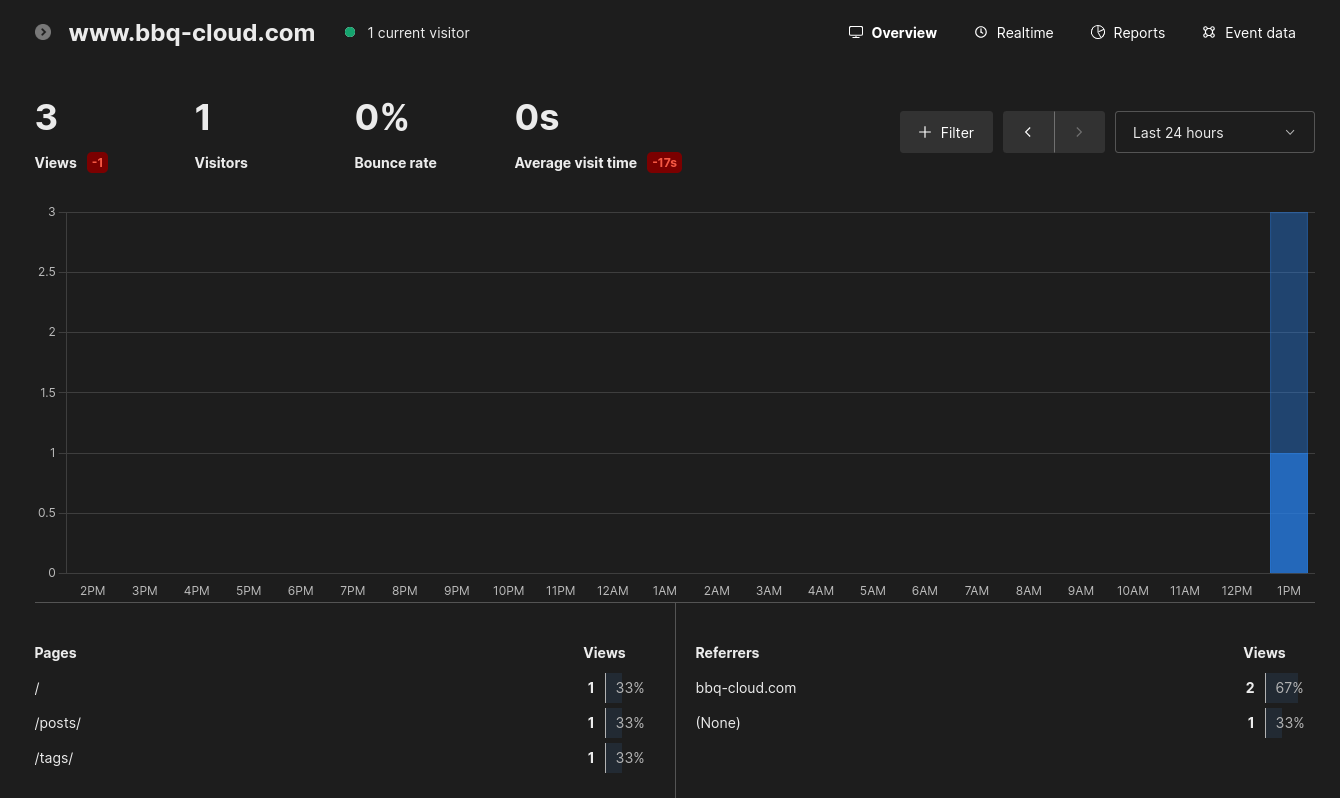
As the site is not online the dash is pretty empty but you get the idea
Logging stack
I’m still testing this on my setup because I have issue with storage right now ( space ) that I have to migrate but my previous tests where good. The setup I am evalutating is Loki installed in scalable mode with the official helm chart. The grafana agent is installed in Operator mode and use Promtail ( the loki agent ) under the hood to gather logs from my Pods. I managed to gather the acces log of my Traefik ingress controler without problem.
I used the same technique as CNPG and Prometheus for storage, local persistent volumes to have maximum performance. Logs are all shipped by Loki to my NAS via S3 protocol.
PVC Backups
I use K8up to backup all my kubernetes persistent volumes.
Oversafe backup strategy…
Objects that I backup :
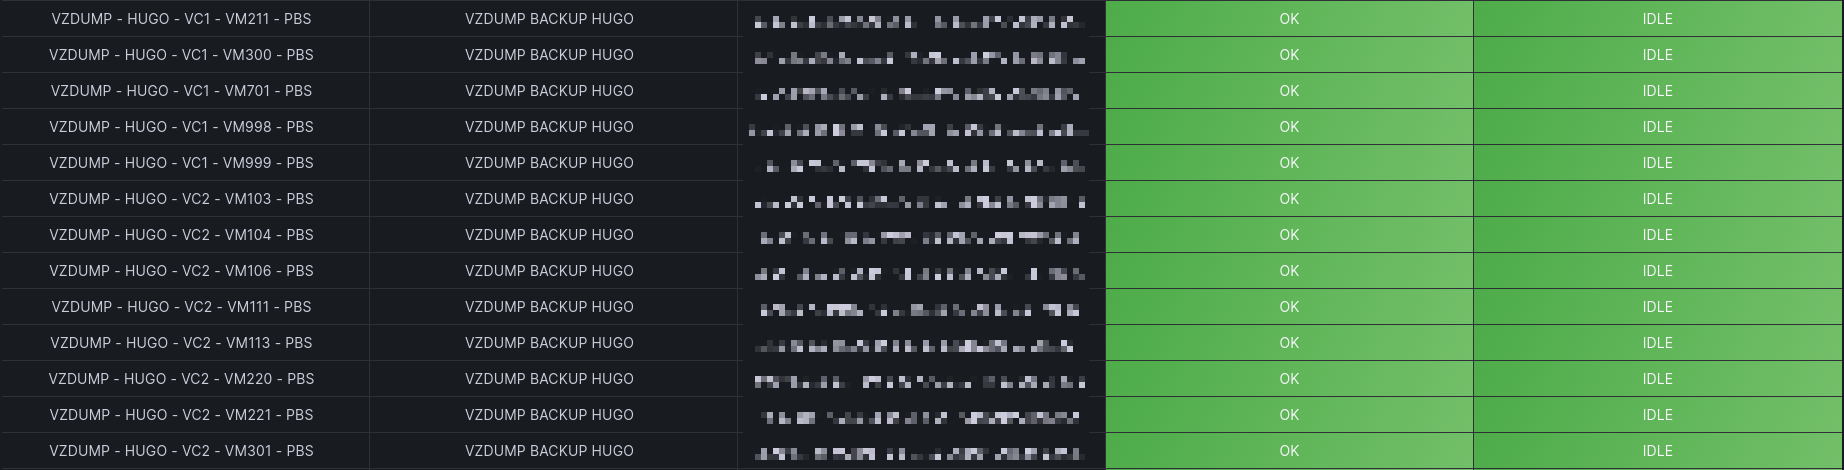
- Host themselves with the Proxmox backup client CLI in a cronjob => to the pbs server
- Virtuals machines config and drive with => to the pbs server
- Kubernetes PVC with K8UP => to my NAS
- CNPG Databases => to my NAS
- Longhorn PVC with longhorn backup system => to my NAS
- Configurations => to my GIT that is a saved vm to the pbs server
The nas is snapshoted several times a day as I use btrfs and I sync it to an offsite NAS every evening.
The proxmox backup server is also synced to offsite PBS everyday.
The backups are watched by prometheus or healthcheckio and send teams notifications in case of failure. I also see the failure on karma or grafana.
Let’s now talk about other services